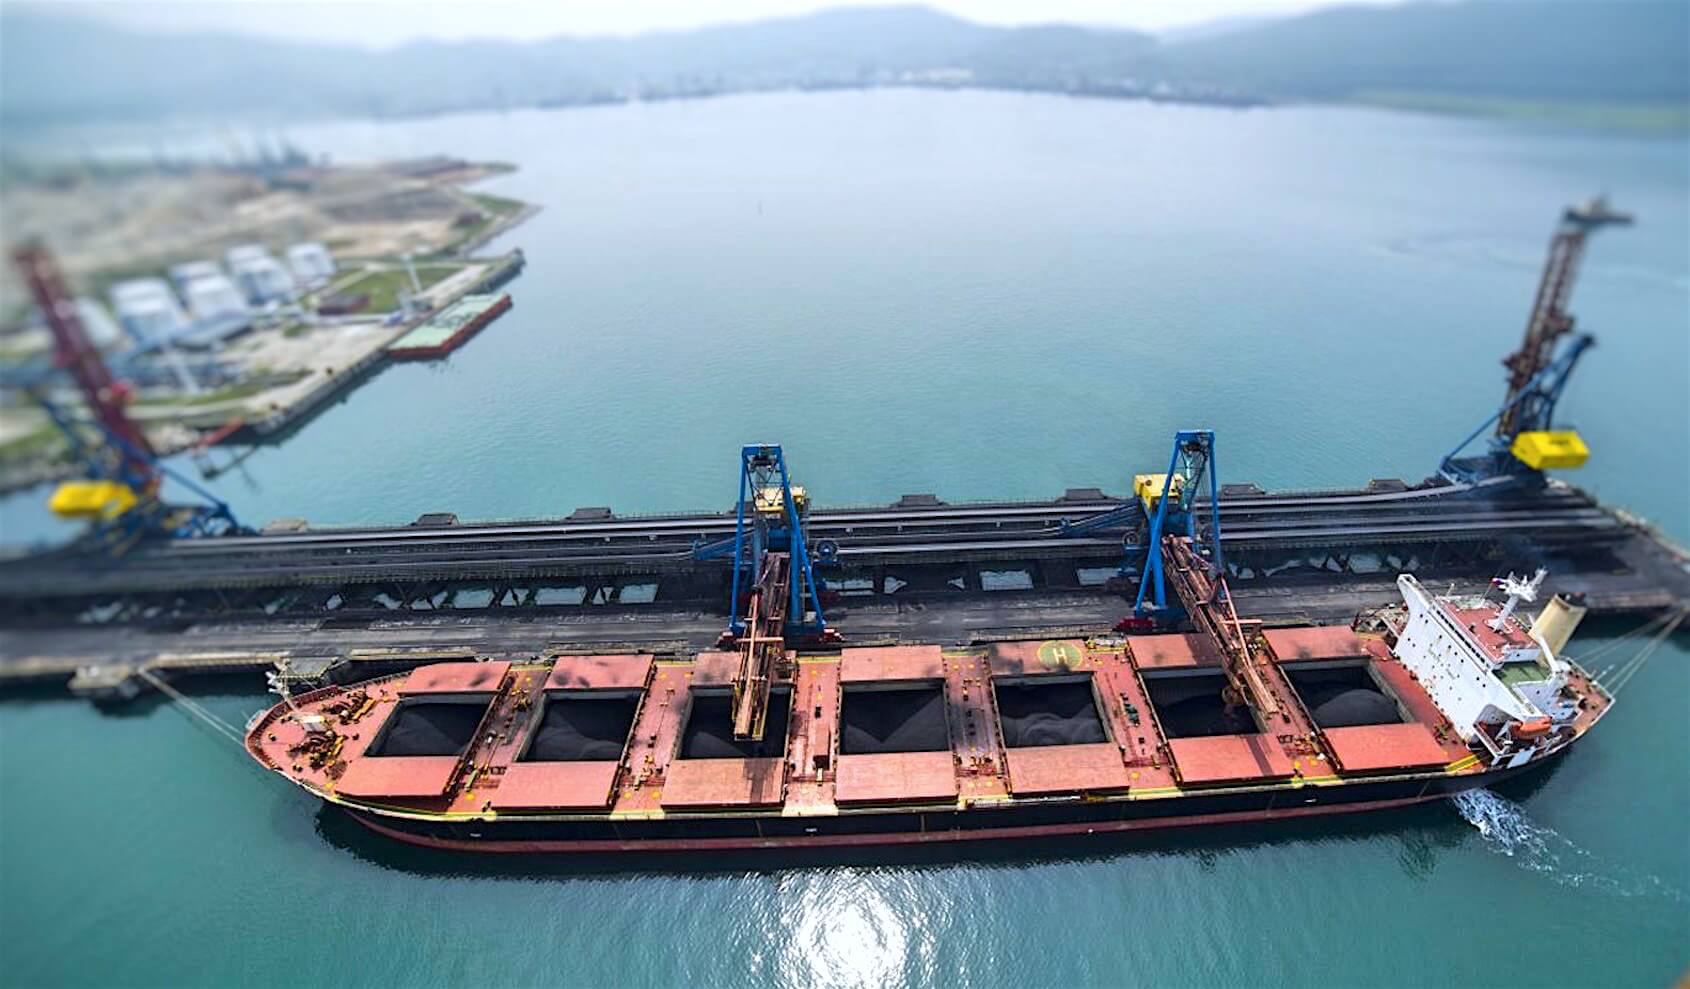
From the reports we have read so far, tried to summarize as much as we can with best endeavor. Expanding at 4 per cent, the fastest growth in five years, global maritime trade gathered momentum and raised sentiment in the shipping industry.
Total volumes reached 10.7 billion tons, reflecting an additional 411 million tons, nearly half of which were made of dry bulk commodities. After five years of decelerating growth, 2017 saw a small improvement in world fleet expansion. During the year, a total of 42 million gross tons were added to global tonnage, equivalent to a 3.3 per cent growth rate.
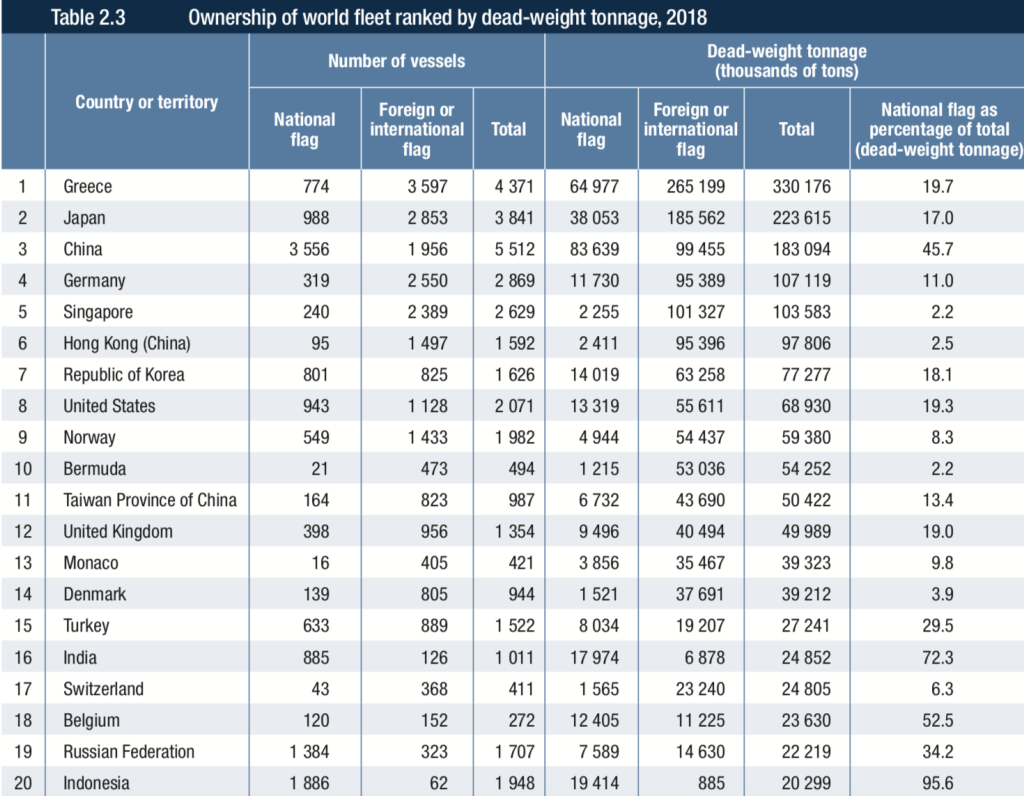
With regard to the shipping value chain, Germany remained the largest container ship-owning country, although it lost some ground in 2017. In contrast, owners from Canada, China and Greece expanded their containership-owning market shares.
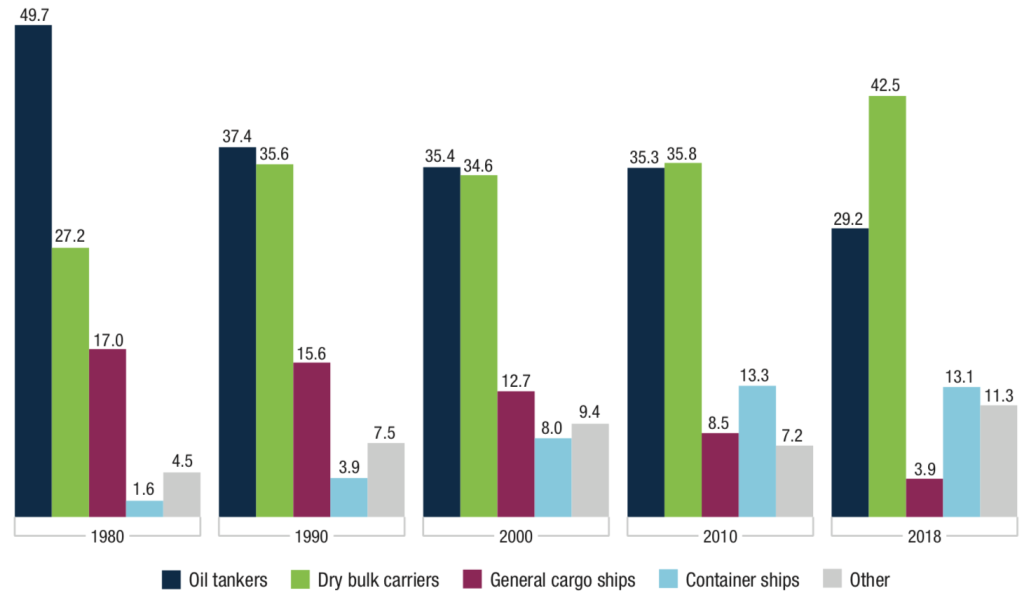
Share of world fleet in dead-weight tonnage by principal vessel type, 1980– 2018 (Percentage)
[/custom_font]
Ownership of world fleet ranked by dead-weight tonnage, 2018
[/custom_font]
Dry bulk
[/custom_font]
Dry bulk fleet growth came in at 3.0% in 2018. Early estimates of global seaborne trade suggest that growth was significantly slower than market experts’ predicted; 2.4% vs 3.2% base/2.7% low case scenario. Trade figures tend to be revised
upwards once the new official data becomes available. Same is expected yet again; however, actual numbers are likely to be closer to low case estimates.
The drop in trade can be attributed to the weakening commodity demand on the back of a sharper-than-expected slowdown in the global manufacturing sector as well as the ongoing US-China trade war. Chinese imports also took a hit in Q4 due to disappointing industrial activity, the winter pollution controls, iron ore destocking and coal import restrictions.

On the demand side
On the demand side, it’s obvious that US and China will reach some sort of an agreement that they “can survive”, it will not be back-to-normal for trade. Unless China changes the structure of its economy fundamentally (which seems unlikely) the competition between the world’s two largest economies will continue to act as a drag on global growth. Thus, global seaborne trade growth should average 2.3% p.a. between 2019 and 2021.
On the supply side
On the supply side, although there is higher demolition rates than previously, due to unreported new building contracts were added to the order book, seems fleet growth to accelerate from 3% in 2018 to 3.2% in 2019 and 3.4% in 2020 before slowing to 1.8% in 2021. Demand will still improve in 2019 as the Chinese Government shifts its attention from deleveraging to shoring up the economy. Expecting policymakers to ease shadow lending in 1H19 to boost infrastructure spending, then ease property measures significantly in 2H19. The Government has already announced $125bn worth of new railway investment this year. More projects are set to be rolled out, with details expected to be released following the National People’s Congress in Mar-19.
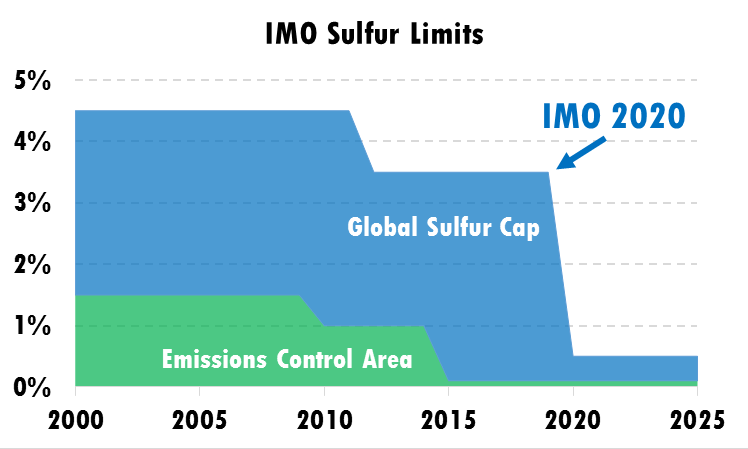
#IMO2020
2019 will also see the global commercial fleet switching from HFO to low-sulphur fuels. IMO2020 is probably the biggest regulatory change in shipping history and will have significant implications on active fleet supply. Over 400 dry bulk carriers (266 capes, 141 others) are scheduled to retrofit scrubbers in 2019~ and 10,000+
will have to clean fuel tanks in order to switch to compliant fuels. The active fleet is likely to expand much slower than the 3.2% growth that currently predicted for the theoretical carrying capacity as a result. Together with the anticipated improvement in trade, rates are expected to rise further this year.
Notes
- In 2019 demolition picks up but the orderbook is also adjusted significantly higher as previously unreported orders are added to the delivery schedule. Deliveries increase more than the rise in demolition and fleet growth picks up as a result. Risk Factor; A rapid increase in demolition activity and rise in freight rates due to IMO2020 may lead to a change in sentiment and ordering may once again surge.
- Ordering remains low in 2019 as demand matures and the cost of financing increase. Some new ordering takes place in 2020 for fleet renewal purposes. Scrapping rises significantly in 2020 as high bunker prices hit older, heavy consuming ships. Demolition remains elevated in 2021 for the same reasons but also due to the phasing out of VLCC converted to VLOC’s. Risk Factor; Although this would be for fleet-renewal purposes there is always a good chance of over- ordering, given the industry’s track record.
- IMO2020 preparations and fleet inefficiencies due to fuel switching reduce activefleet supply and take the edge off deliveries in 2019-20. Slow steaming prevails in 2020-21
Tanker Fleet
The headwinds that caused the tanker market collapse in 2016-17 are turning in to tailwinds. Following the 2014 oil price crash, OPEC decided to cut supplies aggressively to prop up prices between 2015-17.A sharp drop in supplies from Venezuela and Iran restricted supplies further.
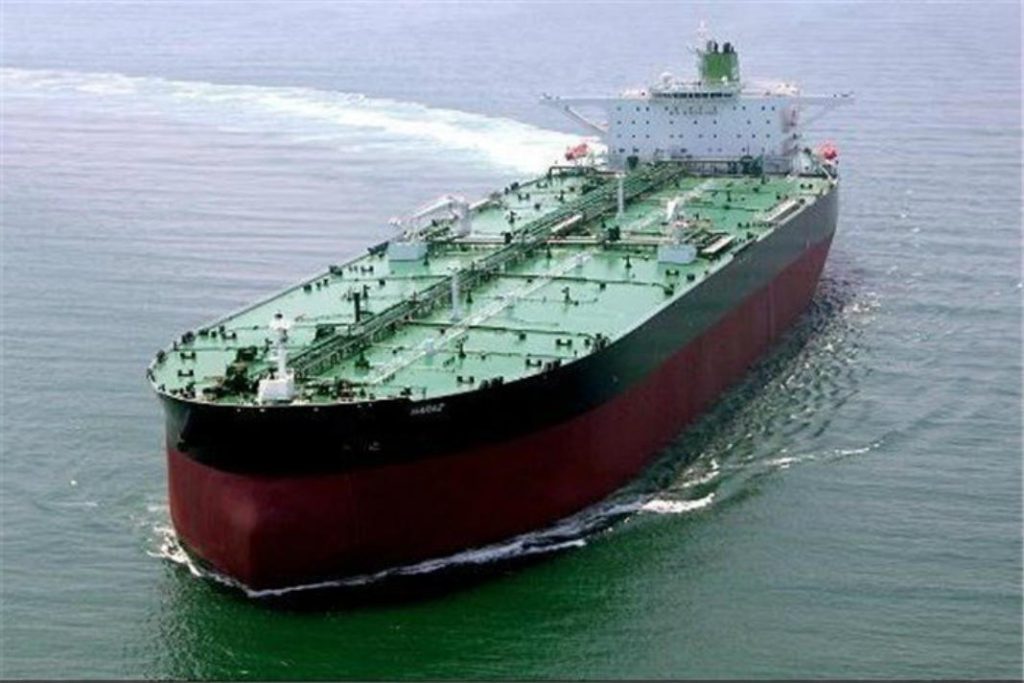
The sharp drop in prices also incentivized heavy consuming nations to build inventories to record levels. The steady increase in prices from the middle of 2016-17 triggered a destocking cycle in the crude oil and products markets.
As the stocks mainly were built in consuming regions, inventory draw-downs reduced transportation requirements. Supply, on the other hand, was growing rapidly; as the destocking gathered pace floating storage trades were unwound, releasing a large number of vessels into the market. That coincided with rising supply as the ships ordered during the 2014-15 boom started to join the fleet. Earnings collapsed as a result.
Today the market is in rude health. In 2019, global crude supplies are expected to increase 1.2% y-o-y despite the OPEC cuts; that is 4% higher than the average supplies in 2016-17. Inventories are now normalized and stand below long-term average levels. And despite the recent downward revisions to forecasts global oil demand is expected to grow by 1.5mbpd on average in 2019 and 2020, well above the 1.3mbpd long-term average.
On the supply side, heavy scrapping took the edge off newbuilding deliveries in 2018, both in the crude and product sectors. This year will be another year of heavy deliveries; however the tanker fleet is old, and the scrapping pool is large. We expect demolition to remain high, partly due to an ageing fleet and partly due to the looming regulatory changes rendering heavy consuming ships uneconomical. More importantly, however, deliveries drop sharply in 2020, and this is unlikely to change materially as the earliest berths available at the moment are for late 2020 delivery.
OPEC decided to cut production by 1.2mbpd in 2019 to support falling oil prices. At the face of it, the decision is bearish news for the tanker market. However, it should have limited impact on tanker demand as
- it’s questionable if they’ll be able to deliver the proposed cuts, i.e.the actual reduction will be less
- Growth in non-OPEC supplies will more than off set the dropin OPEC output.
Seems, OPEC was forced to announce an aggressive cut in December to arrest the sharp drop in prices.
However, looks like the oil market is tighter then the consensus believes and prices will continue to rise steadily. There are a few fundamental reasons for that;
- production is fast declining elsewhere; Venezuela is still out of the market and Chinese production is in decline
- The market has over-reacted to the US waivers given to the eight largest buyers of Iranian crude; the waivers will expire in April and Iran will mostly be out of the market again, theoretically at least anyway
- Refineries are likely to increase crude runs to the extent of 0.5mbpd-1.5mbpd in order to supply sufficient amounts of compliant fuels to the marine industry as a result of the IMO 2020 emissions regulations.
All of these factors are likely to put upward pressure on oil prices in the coming months. OPEC is already under pressure from the US to raise its output to keep prices under control. Once prices reach a certain level and stabilize-in or view- somewhere in the $65-$75 per barrel range, OPEC is likely to ease its production cuts.
Bunkers
- Oil prices is expected to remain around $60-$70pb levels in 1H19 but steadily rise in 2H19 as the supply & demand balance tightens and markets start to price in the impact of the marine fuel specification changes. A more pronounced rise in light-sweet crude prices as they yield higher middle distillates
- MGO prices start rising from the middle of 2019 and peak in 2020, especially in 1H20 as the majority of the non-scrubber fitted fleet opt-in for MGO or other straight-run products instead of blends. HFO prices decline sharply due to a substantial surplus
- As fuel spreads rise and refinery margins improve refineries start producing higher volumes of compliant fuels, and prices start to stabilise from 2H20-2021 onwards
Risk Factor
- The biggest risk is the uncertainty surrounding the time it will take the refining industry to adapt to the new demand environment. The transition period could be relatively short (12-18 months) or much longer (2-5 years). Longer period of elevated bunker prices could scupper trade. On a more positive note this could also lead to higher scrapping and slower steaming
- New technologies, such as blockchain, autonomous ships and drones offer potential benefits in shipping, but also give rise to concerns, including about safety, seafarer employment, cybersecurity and liability and insurance.
Opportunity
Vessel and cargo-tracking systems are developing quickly. Technological developments can help in generating business intelligence for asset management and optimized operations, for example in the provision of data on fuel consumption and engine performance. Such systems also allow for the identification and monitoring of a ship’s position, as well as for the monitoring of other aspects that might be important with regard to manoeuvrings and stabilizing route and course, improving security and ensuring the safety of crew.
References
– Flash note dry & wet market review by Arrow
– Review of maritime transport 2018 by United Nations

